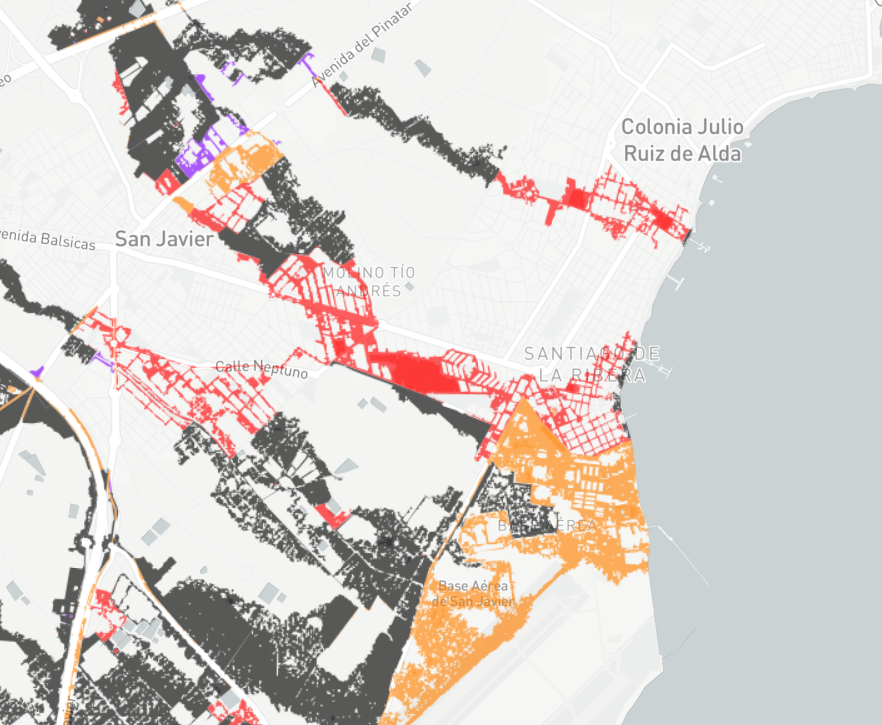
Risk areas#
These maps show the potential adverse consequences associated with flooding according to the type of economic activity in the area that may be affected, and associate them with different return periods (10, 100 and 500 years).
Visualization#
3 return periods are displayed:
10 year return period.
100 year return period.
500 year return period.
To facilitate visualization, the number of categories has been simplified into:
- Urbano
- Industrial
- Infraestructura
- Otros

The original categories and their correspondence can be found below:
AU : Associated with urban → Urban
AC : Concentrated urban → Urban
UD : Urban dispersed → Urban
UR : Construction associated with urban → Urban
URC : Construction associated with concentrated urban → Urban
URD : Construction associated with dispersed urban → Urban
INC : Concentrated industrial → Industrial
IND : Industrial dispersed → Industrial
ICO : Mixed industrial → Industrial
IA : Airport infrastructures → Infrastructure
IC : Infrastructures: communications → Infrastructure
ICA : Infrastructures: roads → Infrastructure
IE : Infrastructures: energy → Infrastructure
IF : Infrastructures: railways → Infrastructure
IH : Hydraulic-sanitary infrastructures → Infrastructure
IR : Infrastructures: waste → Infrastructure
IS : Social infrastructure → Infrastructure
Data sources#
For the internal basins of Catalonia (CIC), data provided by Civil Protection of Catalonia (DGPC).
Credits: Dirección General de Protección Civil de la Generalitat de Catalunya
Georeferenced data obtained through the download portal of the Ministerio para la Transición Ecológica (MITECO).
Credits: Ministerio para la Transición Ecológica y el Reto Demográfico
Note
Last update on the platform: June 2021.