Rain accumulation#
Weather radars provide snapshots of the precipitation field. The calculation of accumulations requires a process in which the precipitation movement field is determined in order to take into account the areas affected by the precipitation between the time instants measured by the radar.
Calculation method#
The first step is the calculation of the precipitation between two consecutive radar images, which will serve as a basis for higher accumulations. This process consists of generating, by spatio-temporal interpolation, the minute rainfall images between the instantaneous images. To do this, a technique is applied that uses a tracking algorithm that assumes that the precipitation field moves with constant velocity from one image to another. Thus, a field of displacement vectors is calculated by correlating consecutive images, which is used to shift one rainfall field with respect to the previous one and simultaneously linearly interpolate the rainfall values.
The importance of such accumulation is very considerable in stormy episodes, where otherwise the movement of the nuclei would not be adequately reflected if the accumulated rainfall were generated by direct summation of the consecutive images (the areas between the two images would be left without rain; as shown in the example in Figure 1).
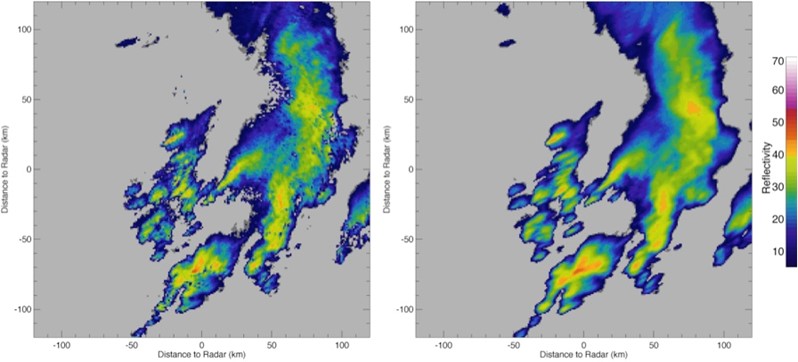
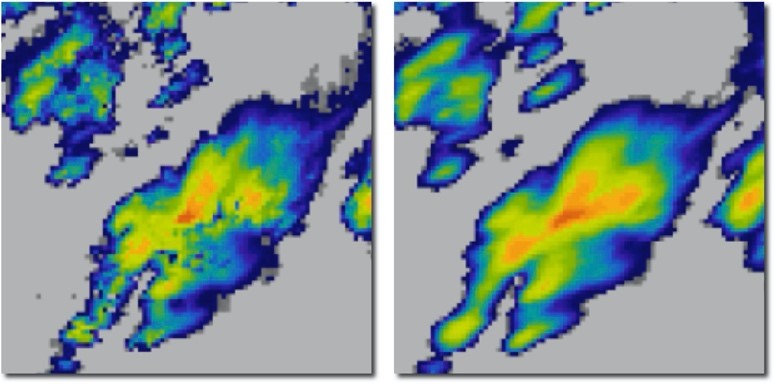
Figure 1. Example of the radar data accumulation process (for 10-minute accumulations) of Sánchez-Diezma (2001) applied to AEMET radar data. Above: on the left without the accumulation process described, and on the right following this process. At the bottom is a zoom of the lower part of the previous images where it can be seen how the image on the right shows a much more continuous field.#
Useful links#
SMC Radar - Rainfall accumulation#
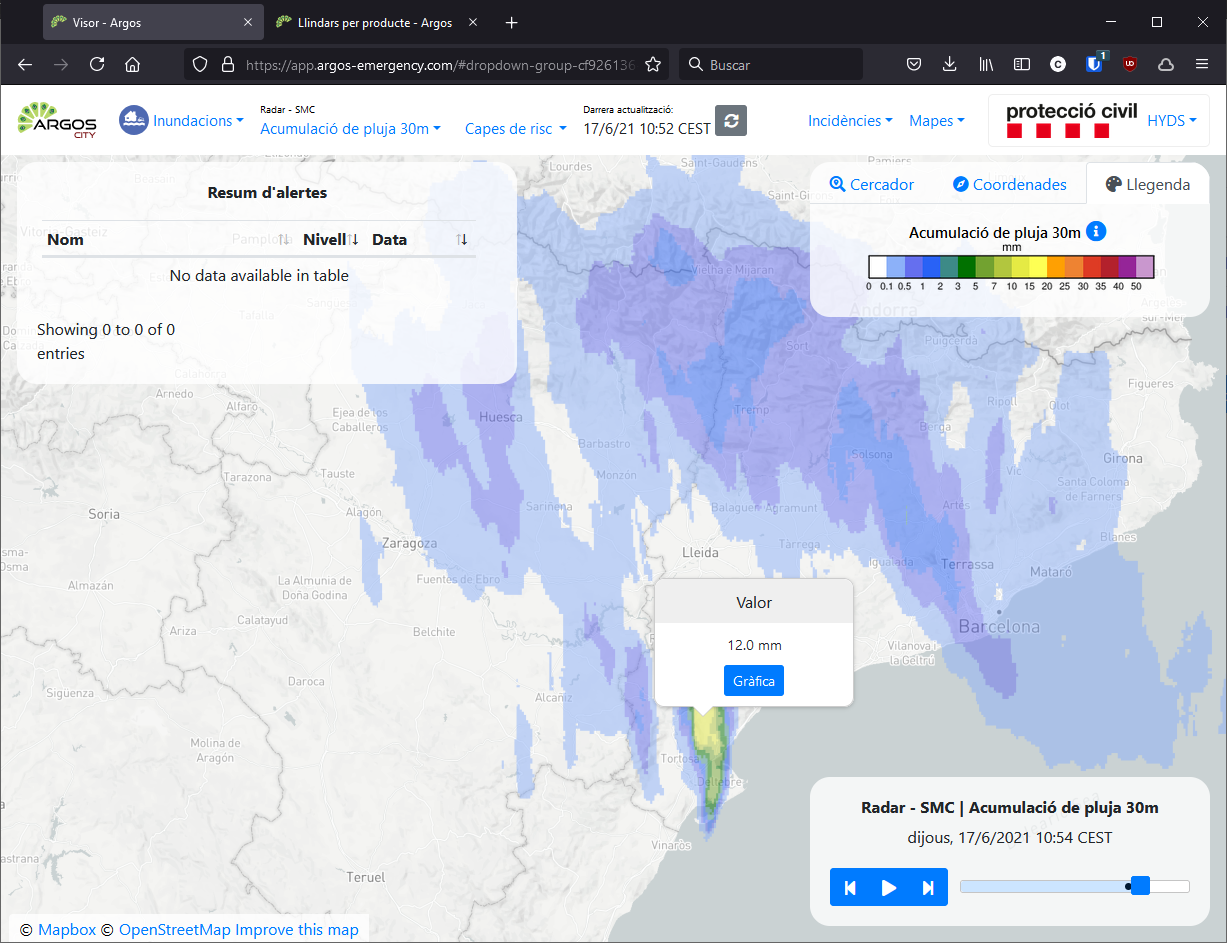
From the instantaneous images of the radar network of the Servei Meteorològic de Catalunya (SMC), a technique of Nowcasting is applied to generate a rainfall forecast for the next hours. Based on this forecast, the rainfall accumulation is calculated following the process described above.
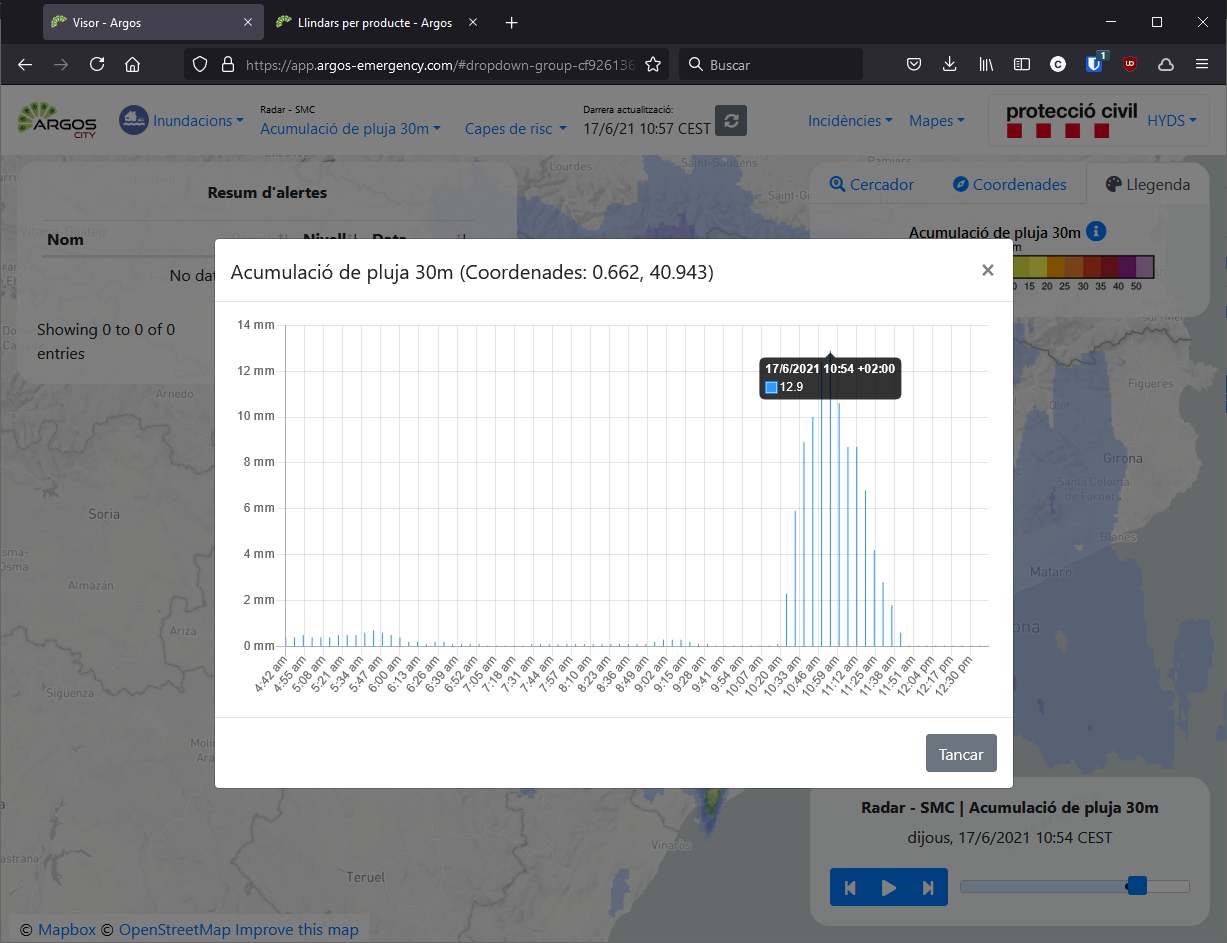
The accumulated rainfall is calculated for each time step with the above instantaneous rainfall fields, following a sliding window scheme. The following scheme illustrates how the observed and forecast instantaneous fields are grouped together to calculate 30-minute accumulations every 6 minutes.

The following accumulations can be explored:
Accumulation period |
Available range |
Temporal resolution |
Update frequency |
Moving window |
|
|---|---|---|---|---|---|
6min |
6h of observations and 2h of forecasts |
6min |
6min |
Yes |
|
30min |
6h of observations and 2h of forecasts |
6min |
6min |
Yes |
|
1h |
6h of observations and 2h of forecasts |
6min |
6min |
Yes |
|
3h |
24h of observations |
1h |
1h |
Yes |
|
6h |
24h of observations |
1h |
1h |
Yes |
|
12h |
24h of observations |
1h |
1h |
Yes |
|
24h |
24h of observations |
1h |
1h |
Yes |
|
Daily accumulation |
7d of observations |
24h |
24h |
No |
|
Visualization#
Data sources#
The SMC radar network is used.
AEMET Radar - Acumulación de lluvia#
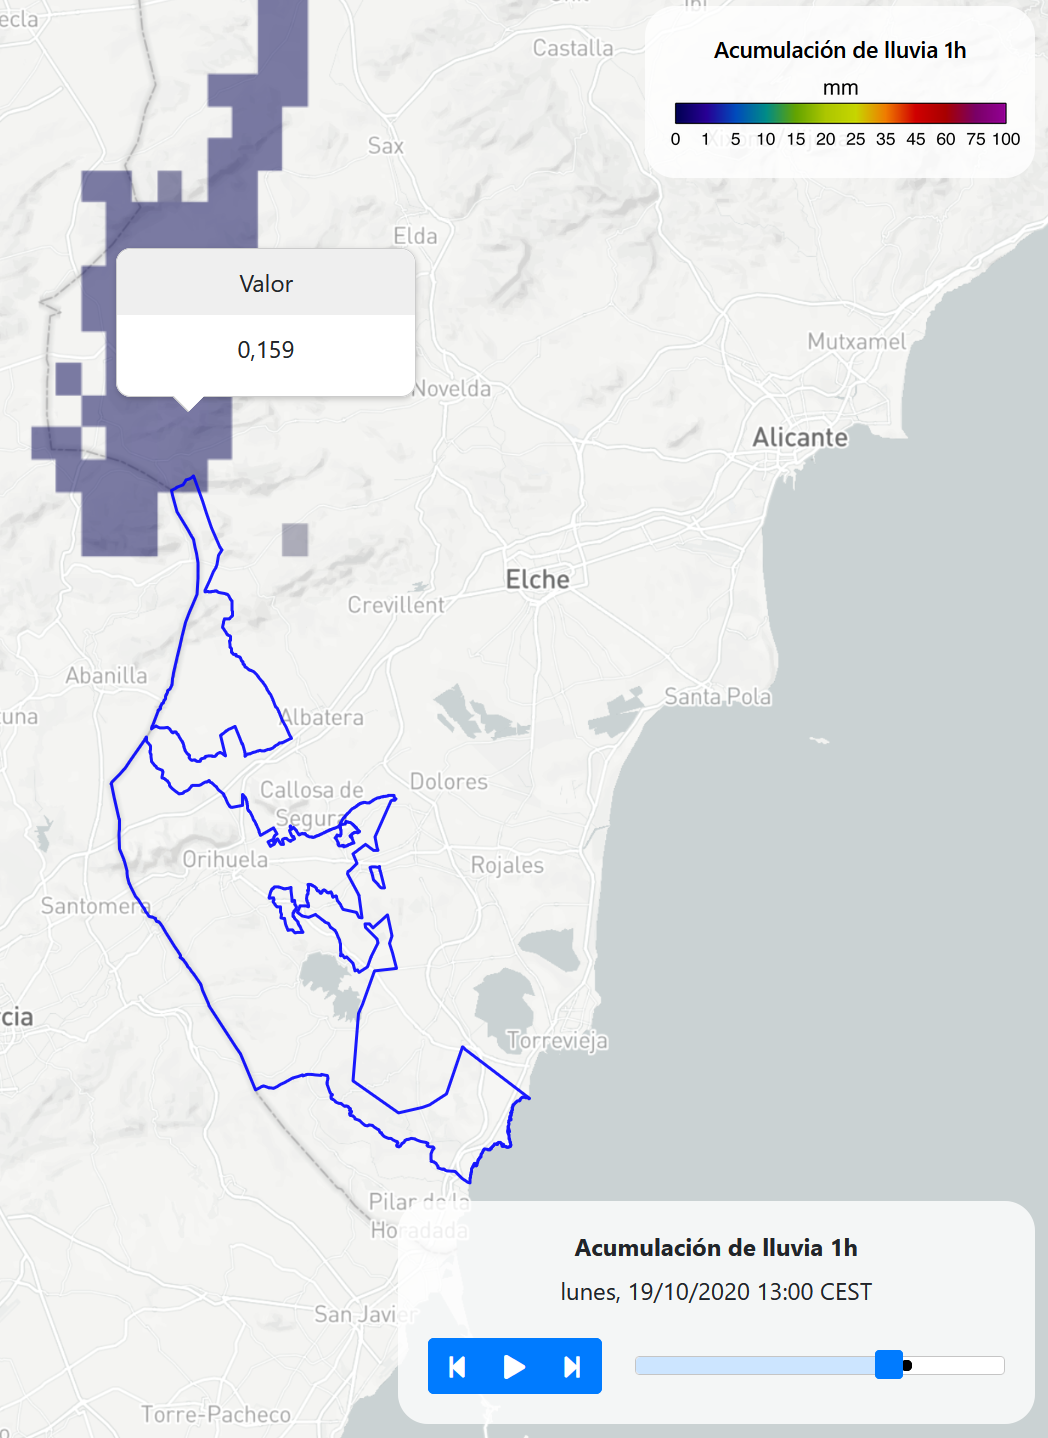
From the instantaneous images of the radar network of the State Meteorological Agency (AEMET), a technique of Nowcasting is applied to generate a precipitation forecast for the next hours. Based on this forecast, the rainfall accumulation is calculated following the process described above.
The following accumulations can be explored:
Accumulation period |
Available range |
Temporal resolution |
Update frequency |
Moving window |
|
|---|---|---|---|---|---|
10min |
6h of observations and 2h of forecasts |
10min |
10min |
Yes |
|
1h |
6h of observations and 2h of forecasts |
10min |
10min |
Yes |
|
3h |
24h of observations |
1h |
1h |
Yes |
|
6h |
24h of observations |
1h |
1h |
Yes |
|
12h |
24h of observations |
1h |
1h |
Yes |
|
24h |
24h of observations |
1h |
1h |
Yes |
|
Daily accumulation |
7d of observations |
24h |
24h |
No |
|
Visualization#
Data sources#
The AEMET radar network is used.
Met Éireann Radar - Rainfall accumulation#
The latest Rainfall Radar showing live precipitation over Ireland, updated every 5 minutes. Precipitation can be rain, hail or snow. Images are a combination of Met Éireann and Met Office radar in Dublin, Shannon, Armagh and Wales, when available.
Rainfall Radar does not detect low lying precipitation such as drizzle, this is due to a number of reasons - primarily because radar antenna point upwards and may miss low level precipitation occurring under its detection area; also distance from the radar and topographical features can limit and hinder the precipitation it detects.
Rainfall radar systems are subject to frequent maintenance checks, individual units are powered off during these times, this will affect and reduce the radar images in that surrounding area. Maintenance notices are often posted on the Met Éireann Twitter page.
Miscellaneous rainfall images may appear on the radar map from time to time, examples are below:
“ground clutter” may appear, this is usually apparent in various parts of Co. Dublin. It is not real precipitation and should be ignored. We advise to play the last few images of the animation, this will show the movement of any genuine precipitation images that the radar has processed.
Bright Bands may also occur as circles of precipitation around a radar, often in winter months due to reflectivity of wintry types of precipitation at higher levels in the atmosphere.
Spokes can appear as long shadows of “rain”, this can happen when there is some interference to the radar signal. It is not real precipitation and should be ignored.
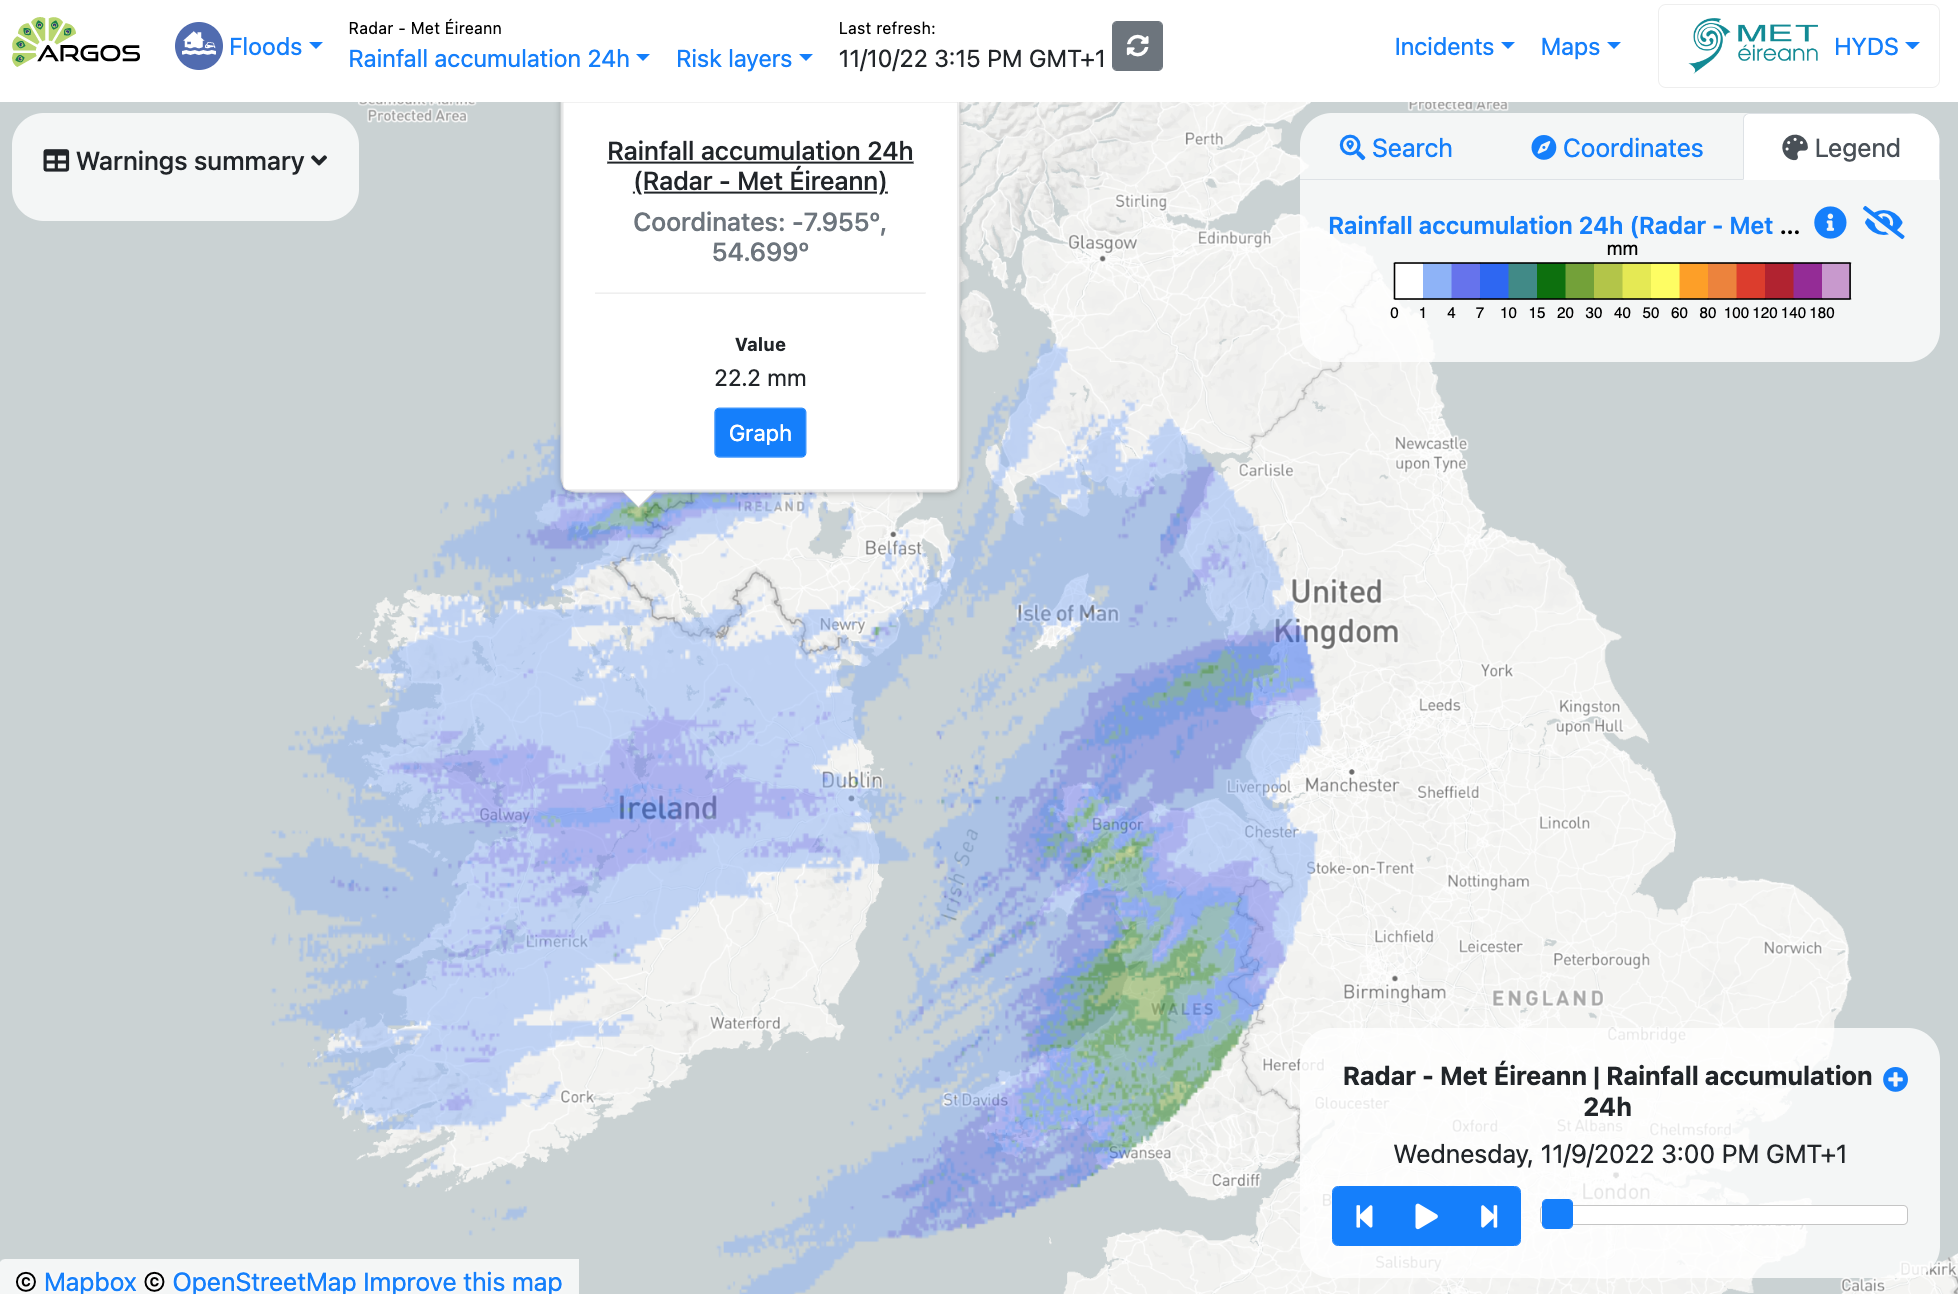
From the instantaneous images of the radar network of Met Éireann, a technique of Nowcasting is applied to generate a precipitation forecast for the next hours. Based on this forecast, the rainfall accumulation is calculated following the process described above.
The following accumulations can be explored:
Accumulation period |
Available range |
Temporal resolution |
Update frequency |
Moving window |
|
|---|---|---|---|---|---|
5min |
6h of observations and 2h of forecasts |
5min |
5min |
Yes |
|
30min |
6h of observations and 2h of forecasts |
5min |
5min |
Yes |
|
1h |
6h of observations and 2h of forecasts |
5min |
5min |
Yes |
|
3h |
24h of observations |
1h |
1h |
Yes |
|
6h |
24h of observations |
1h |
1h |
Yes |
|
12h |
24h of observations |
1h |
1h |
Yes |
|
24h |
24h of observations |
1h |
1h |
Yes |
|
Daily accumulation |
7d of observations |
24h |
24h |
No |
|
Update frequency#
Data is updated in real time, every 5 minutes or every hour depending on the product.
Visualization#
Useful links#
Data sources#
Data provided directly by Met Éireann.