Droughts Standardized Indices#
Standardized Indices are used to indicate water deficits in different domains of the water cycle (precipitation, evaporation, groundwater and river flow). The most well- known is the Standardized Precipitation Index (SPI). The SPI allows determination of the rarity of a drought at a given time scale (temporal resolution, aggregation level) of interest for any site (e.g. grid map) with historic precipitation data (WMO, 2012). It can also be used to determine periods of anomalously wet events.
Mostly, the SPI is used for drought monitoring, but it can also be applied in the forecasting mode, if precipitation forecasts are available. In the platform Seasonal Forecast issued by the ECMWF are used, so gridded indices are available for a forecast with an horizon of 7 months.
The SPI is developed by McKee et al. (1993). The SPI calculation for each grid cell is based on the long-term precipitation record for a desired period. This long-term record is fitted to a probability distribution (usually a gamma distribution), which is then transformed into a normal distribution so that the median SPI for the site and desired period is zero. Positive SPI values indicate greater than median precipitation and negative values indicate less than median.
The SPI is designed to quantify the precipitation deficit for multiple timescales, or aggregation windows, e.g. from 1 month up to 24 months (SPI-1, SPI-24). For example, SPI-1 at the end of August compares the 1-month precipitation total for August in that particular year with the August precipitation totals of all the years on record. Because the 1-month SPI describes short-term conditions, it reflects meteorological drought. The timescales are used by some people to reflect the impacts of drought on different water-related sectors makers (WMO, 2012).
Available information#
The following variables are available on the platform:
Standard Precipitation Index for an aggregation of 12 months (SPI-12)
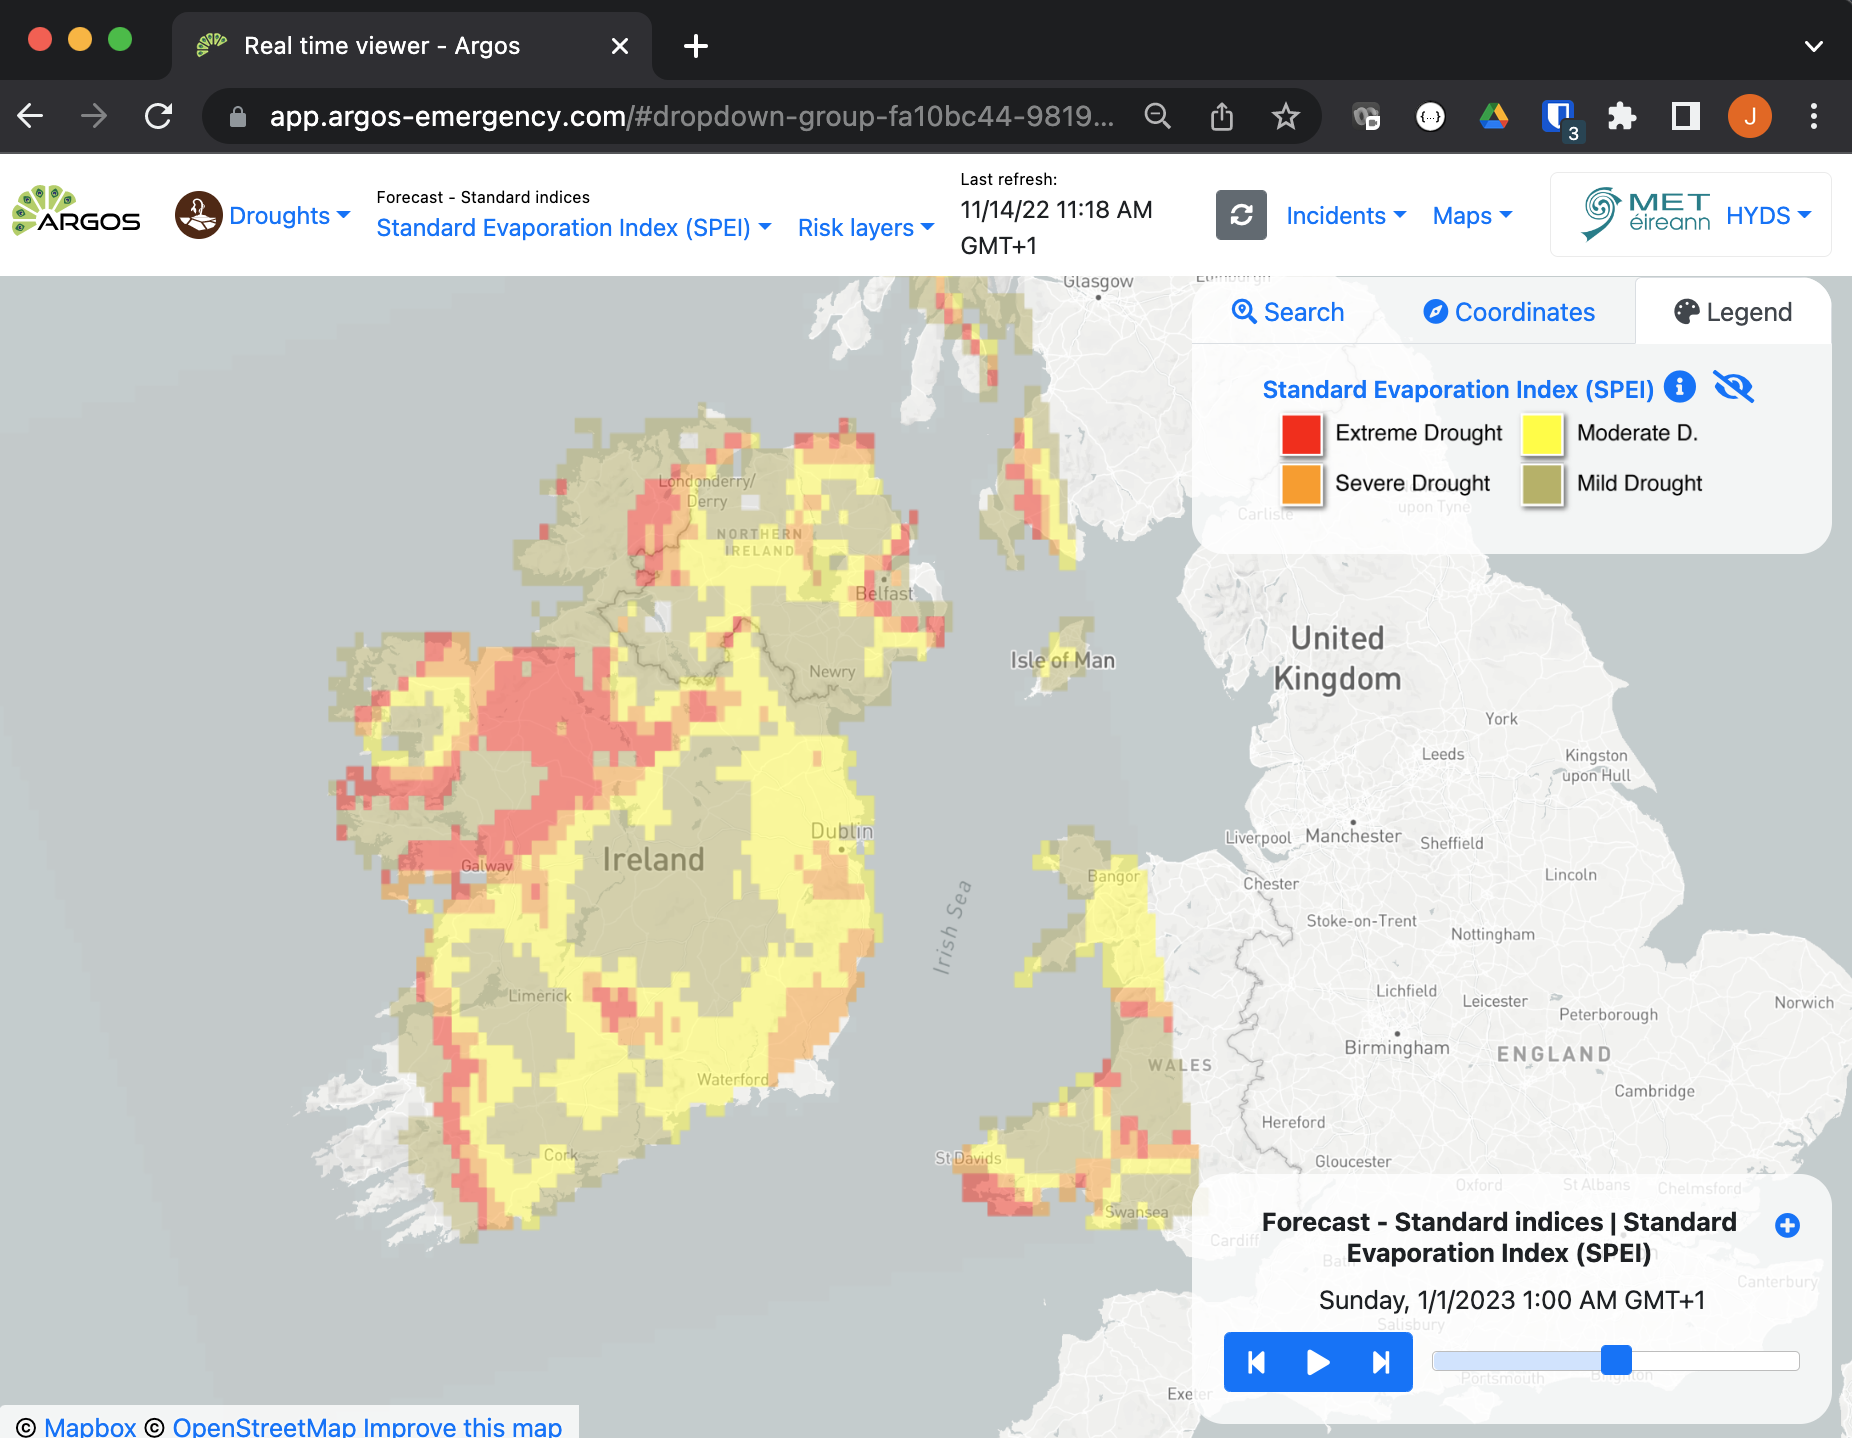
Standard Precipitation and Evaporation Index for an aggregation of 3 months (SPEI-3)
Temporal resolution#
The forecasts have an horizon of 7 months and an temporal resolution of 1 month.
Update frequency#
Seasonal forecasts are updated once a month, so are the standardized indices.
Visualization#

Useful links#
Data sources#
Seasonal forecasts are provided by ECMWF.
References#
Sutanto, S. J., Van Lanen, H. A. J., Wetterhall, F., and Llort, X.: Potential of pan-European seasonal hydrometeorological drought forecasts obtained from a multi-hazard early warning system, Bulletin of the American Meteorological Society, https://doi.org/10.1175/BAMS-D-18-0196.1, 2020
Sutanto, S. J., van der Weert, M., Blauhut, V., and Van Lanen, H. A. J.: Skill of large-scale seasonal drought impact forecasts, Natural Hazards and Earth System Sciences, 20, 1595-1608, https://doi.org/10.5194/nhess-20-1595-2020, 2020
Sutanto, S. J., Van der Weert, M., Wanders, N., Blauhut, V., and Van Lanen, H. A. J.: Moving from drought hazard to drought impact forecasts, Nature Communications, 4945, https://doi.org/10.1038/s41467-019-12840-z, 2019
WMO, 2012: Standardized Precipitation Index User Guide. Svoboda, M., Hayes, M. and Wood (Eds.), World Meteorological Organization Report WMO-No. 1090, Geneva, Switzerland.
McKee, T.B., Doesken, N.J. and Kleist, J., 1993: The relationship of drought frequency and duration to time scale. In: Proc. of 8th Conf. on Applied Climatology, Anaheim, California,17–22 January 1993. Boston, American Meteorological Society, 179–184.