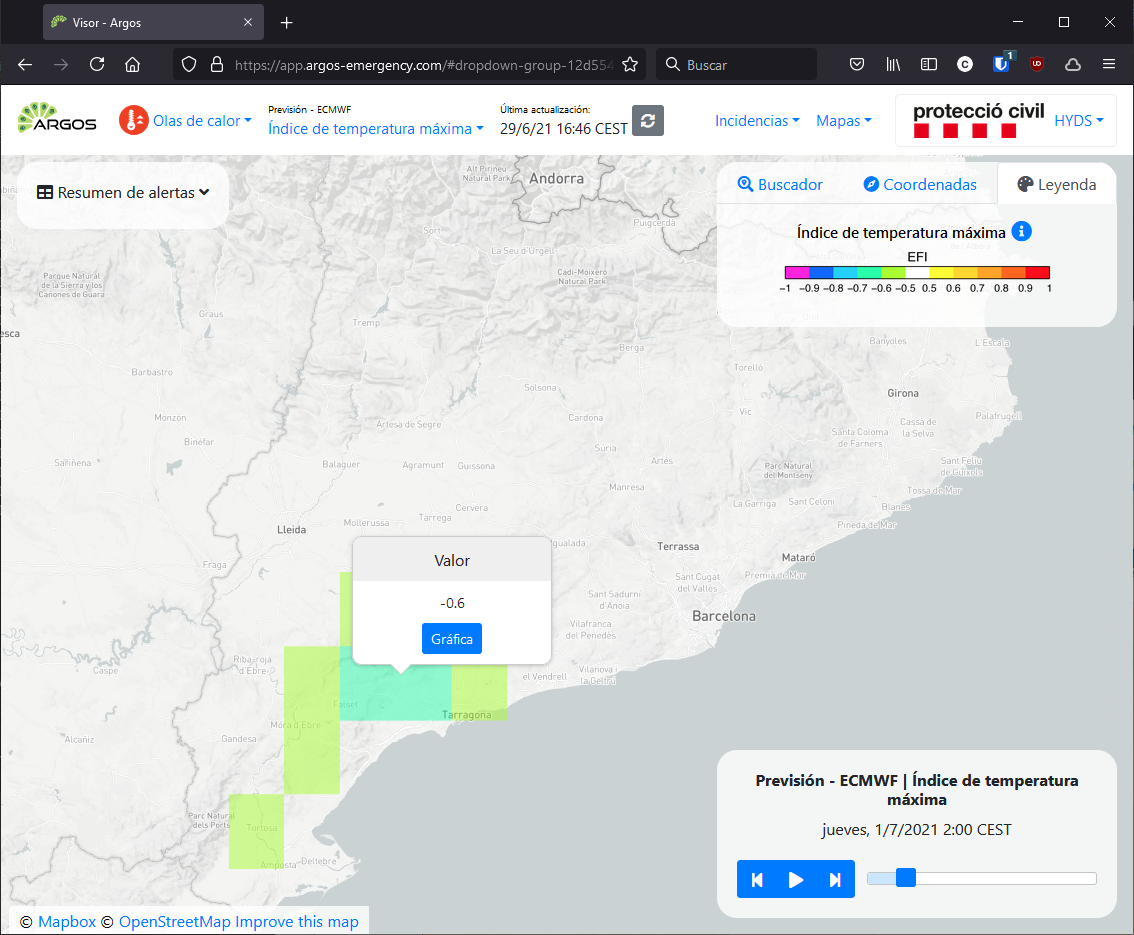
EFI numerical models#
The Extreme Forcast Index (EFI) was developed by the European Center for Medium-Range Weather Forecast (ECMWF) as a tool to provide initial general guidance on possible extreme weather events. It is specifically constructed to highlight occasions when there is a significant shift towards extremes in the climate model.
If the predicted probability distribution agrees with the climatology, EFI = 0, while positive or negative values indicate that the majority of values are above or below the climatology, respectively. Experience suggests that:
Values between 0.5 and 0.8 or between -0.5 and -0.8 generally mean an unusual event.
Values above 0.8 or below -0.8 usually mean an unusual or extreme event.
When interpreting the values obtained, it should be noted that extreme does not necessarily mean high impact. For example, a forecast of 2mm of rain in the desert.
Temporal and spatial resolution#
The forecast provides data for the next 7 days with a 24h time step.
The spatial resolution is 0.2º x 0.2º lat/long.
Update frequency#
The data is updated once a day following the model run:
00h UTC (Official summer time: 02h CEST. Official winter time: 01h CET).
Available variables#
The following variables are available on the platform
Precipitation index#
Indicates how extreme the total predicted precipitation is relative to the model climate.
The values of this variable range from -1 to +1. However, since precipitation cannot be less than zero, negative values of this parameter calculated for 24-hour (short-term) precipitation do not provide sensitive information (usually a dry day is not extreme/unusual). On the other hand, these values can be useful for precipitation accumulation over longer periods (e.g. 10-15 days), where negative values indicate prolonged periods of dry weather.
In the platform only 24h accumulation is included so the visualisation focuses only on the positive values.
Maximum temperature index#
Indicates how extreme the predicted maximum temperature at 2 metres above the earth’s surface is relative to the model climate.
Values range from -1 to +1.
Minimum temperature index#
Indicates how extreme the predicted minimum temperature is at 2 metres above the earth’s surface relative to the model climate.
Values range from -1 to +1.
Wind speed index#
Indicates how extreme the wind speed forecast is relative to the model climate.
It is calculated from horizontal wind speed data at a height of ten metres above the Earth’s surface.
Values range from -1 to +1.
Wind gust index wind#
Indicates how extreme the wind gust forecast is in relation to the model climate.
The WMO defines a wind gust as the maximum wind gust averaged over 3-second intervals. This duration is shorter than a model time step, so the model derives the magnitude of a gust within each time step from the surface tension averaged over each time step, surface friction, wind shear and stability. The maximum wind gust is then selected from the gusts in each time step for a specific period depending on the extracted data.
The data are obtained at a height of ten metres above the Earth’s surface.
Values range from -1 to +1.
Accumulated snow index#
Indicates how extreme the cumulative snowfall forecast is in relation to the model climate.
Values range from -1 to +1.
Visualization#

Useful links#
Data sources#
Data provided by the European Centre for Medium-Range Weather Forecasts (ECMWF).