Earthquakes from the ICGC#
Earthquakes detected in the last 3 days#
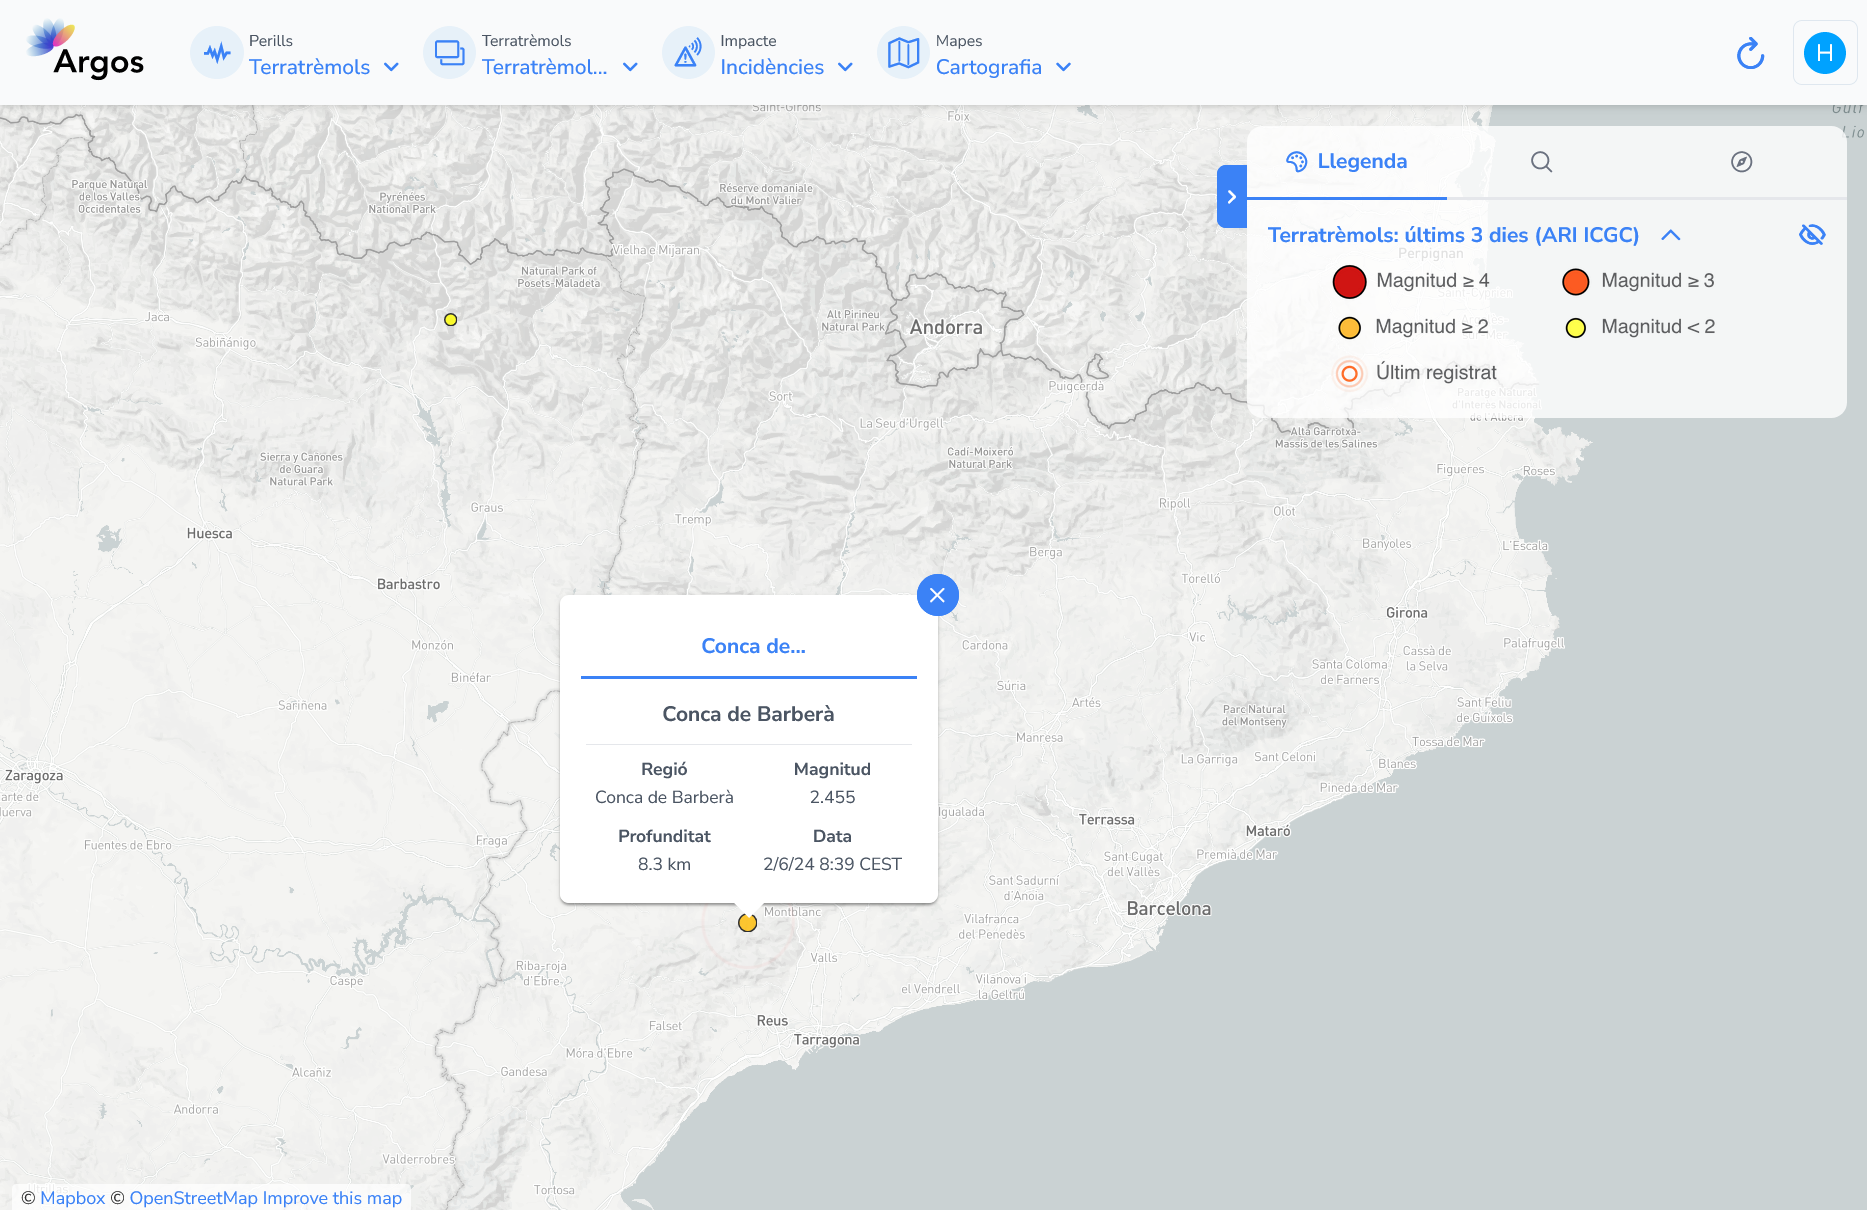
The current product visualizes the earthquakes that have detected in the last 3 days.
In the viewer, each earthquake is represented by a circle on the map, indicating the location where it was detected. The size and color of the circle vary based on the magnitude.
Additionally, the following details are provided for each earthquake:
Magnitude
Intensity (when available)
Depth
Date
Region
Visualization#
